Polygon utilities are a collection of tools designed to handle polygons. A polygon refers to a closed shape defined by a sequence of connected vertices. These utilities offer functionalities to perform various tasks related to polygons, such as manipulation, area calculation, point−in−polygon tests, and more.
Internally, the polygon utilities in Mahotas utilize algorithms and techniques from computational geometry to achieve their functionalities. These underlying algorithms ensure accurate and efficient polygon manipulation and analysis.
Overall, the polygon utilities in Mahotas serve as a toolbox for working with polygons in image processing tasks, offering essential functionalities and algorithms to manipulate, analyze, and perform operations on these shapes efficiently.
Polygon Utilities Functions in Mahotas
Following are the different polygon utility functions available in mahotas −
| S.No | Function & Description |
|---|---|
| 1 |
convexhull() This function creates the smallest shape that encloses a set of points |
| 2 |
fill_convexhull() This function fills the interior of the convex hull generated by a set of points. |
| 3 |
fill_polygon() This function fills the interior of a polygon defined by a set of points. |
| 4 |
line() This function draws a straight line between two specified points. |
Now, let”s briefly understand these four functions and see their examples.
The convexhull() function
The convexhull() function generates the convex hull of a set of points in an image. Convex hull is the smallest polygon that encloses the given points. The function generates the convex hull by identifying the vertices of the polygon and ensuring that all internal angles are less than or equal to 180 degrees.
Syntax
Following is the basic syntax of the convexhull() function in mahotas −
mahotas.polygon.convexhull(bwimg)
where,
-
bwimg − It is the input binary image.
Example
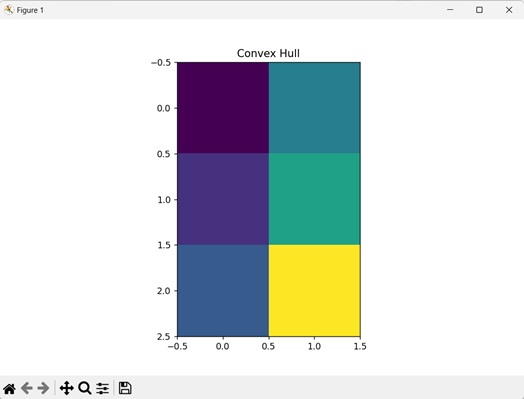
In the example below, we are getting the hull of an image using the convexhull() function.
import mahotas as mh
import numpy as np
import matplotlib.pyplot as mtplt
image = np.zeros((10, 10), bool)
image[2, 5] = 1
image[3, 6] = 1
image[4, 9] = 1
# Computing convex hull
convex_hull = mh.polygon.convexhull(image)
# Printing the value of the hull
print(convex_hull)
# Displaying the convex hull
mtplt.imshow(convex_hull)
mtplt.title(''Convex Hull'')
# Showing the figures
mtplt.show()
Output
Following is the output of the above code −
[[2 5]
 [3 6]
 [4 9]]
The image obtained is as follows −

The fill_convexhull() function
The fill_convexhull() function fills the interior of the convex hull with a color generated by a set of points in an image. The function ensures that all the pixels within the convex hull are assigned a specific color.
Syntax
Following is the basic syntax of the fill_convexhull() function in mahotas −
mahotas.polygon.fill_convexhull(bwimg)
where,
-
bwimg − It is the input binary image.
Example
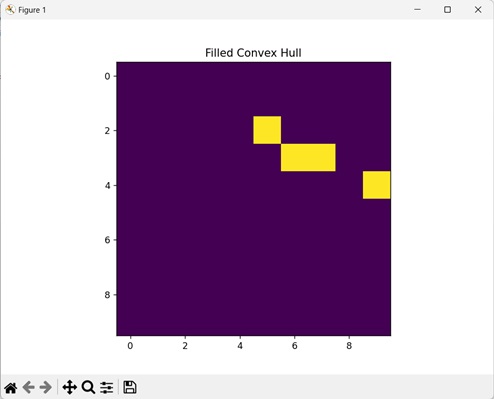
Here, we are filling the hull with color using the fill_convexhull() function.
import mahotas as mh
import numpy as np
import matplotlib.pyplot as mtplt
image = np.zeros((10, 10), bool)
image[2, 5] = 1
image[3, 6] = 1
image[4, 9] = 1
# Filling convex hull
fill_convexhull = mh.polygon.fill_convexhull(image)
# Displaying the filled convex hull
mtplt.imshow(fill_convexhull)
mtplt.title(''Filled Convex Hull'')
# Showing the figures
mtplt.show()
Output
After executing the above code, we get the following output −

The fill_polygon() function
Similarly, the fill_polygon() function is used to fill the interior of a polygon with a specific color in an image. It takes the points representing the polygon shape and performs a filling operation within the boundary of the polygon.
Syntax
Following is the basic syntax of the fill_polygon() function in mahotas −
mahotas.polygon.fill_polygon([(y0, x0), (y1, x1), ..., ], canvas, color=1)
where,
-
[(y0, x0), (y1, x1), …, ] − These are list of (y, x) coordinates that define the shape of the polygon.
-
canvas − It is the image in which the polygon will be filled.
-
color (optional) − It determines the colors of the pixels inside the polygon (default is 1).
Example
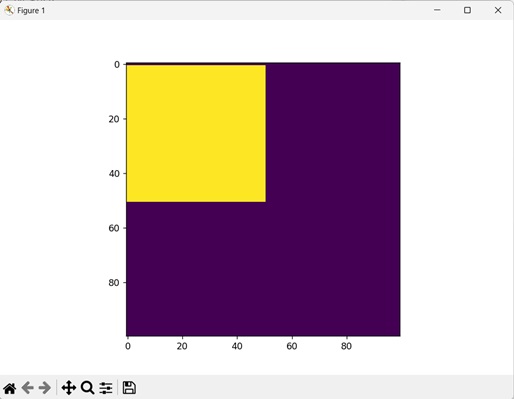
In this example, we are filling a polygon with color using the fill_polygon() function.
import numpy as np
import matplotlib.pyplot as mtplt
import mahotas.polygon as mp
# Create a 100x100 image with all zeros
canvas = np.zeros((100, 100), dtype=np.uint8)
# Define the polygon as a list of (y, x) points
polygon = [(0, 0), (50, 0), (50, 50), (0, 50)]
# Fill the polygon in the canvas.
mp.fill_polygon(polygon, canvas, color=255)
# Display the image
plt.imshow(canvas, cmap=''gray'')
plt.show()
Output
We get the following image as output −

The line() function
The line() function is used to draw a straight line between two specified points (the start and the end) in an image. The points are represented by their x and y coordinates. x0 and y0 are the coordinates of starting point, and x1 and y1 are coordinates of ending point.
Syntax
Following is the basic syntax of the line() function in mahotas −
mahotas.polygon.line((y0, x0), (y1, x1), canvas, color=1)
where,
-
(y0, x0) − It is a tuple which specifies the starting coordinates of the line.
-
(y1, x1) − It is a tuple which specifies the ending coordinates of the line.
-
canvas − It is the image in which the line will be filled.
-
color (optional) − It determines the colors of the pixels inside the polygon (default
is 1).
Example
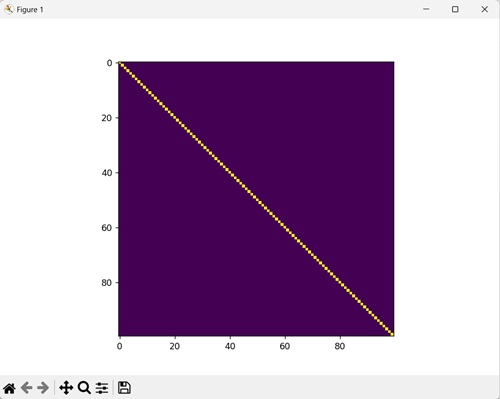
In the following example, we are drawing a colored line using the line() function.
import numpy as np
import matplotlib.pyplot as mtplt
import mahotas.polygon as mp
# Create a 100x100 image with all zeros
canvas = np.zeros((100, 100), dtype=np.uint8)
# Draw a line in the canvas
mp.line((0, 0), (99, 99), canvas, color=255)
# Display the image
mtplt.imshow(canvas)
mtplt.show()
Output
Following is the output of the above code −
