A Kibana dashboard is a collection of visualizations and searches. You can arrange, resize,
and edit the dashboard content and then save the dashboard so you can share it. In this chapter, we will see how to create and edit a dashboard.
Dashboard Creation
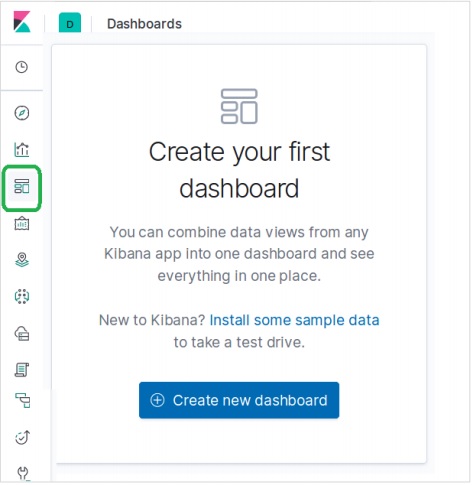
From the Kibana Homepage, select the dashboard option from the left control bars as shown below. This will prompt you to create a new dashboard.
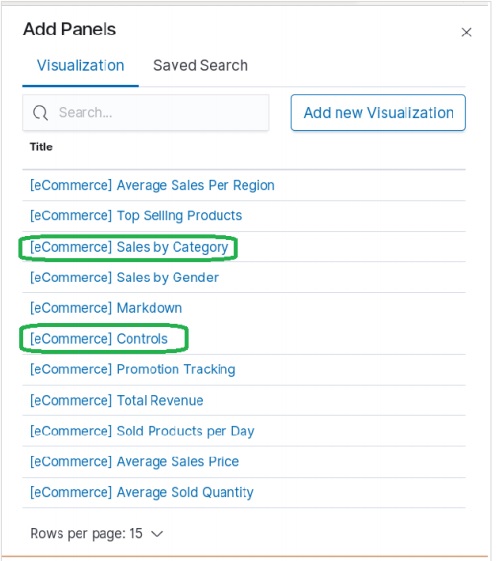
To Add visualizations to the dashboard, we choose the menu Add and the select from the pre-built visualizations available. We chose the following visualization options from the list.
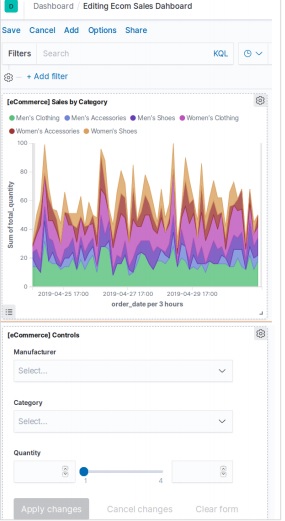
On selecting the above visualizations, we get the dashboard as shown here. We can later add and edit the dashboard for changing the elements and adding the new elements.
Inspecting Elements
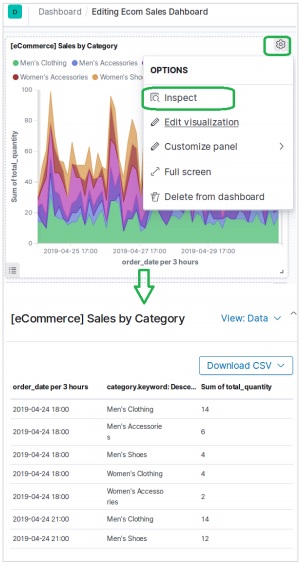
We can inspect the Dashboard elements by choosing the visualizations panel menu and selecting Inspect. This will bring out the data behind the element which also can be downloaded.
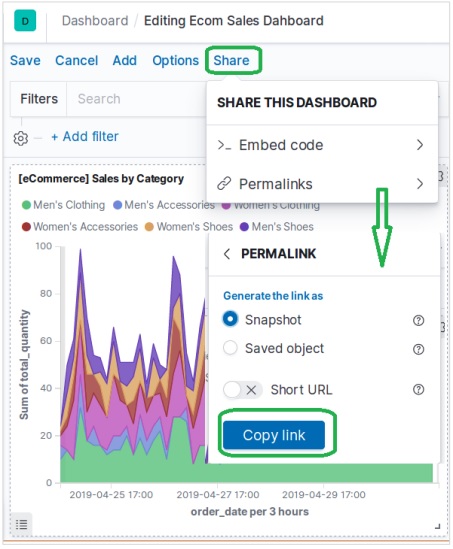
Sharing Dashboard
We can share the dashboard by choosing the share menu and selecting the option to get
a hyperlink as shown below −
