Canvas application is a part of Kibana which allows us to create dynamic, multi-page and
pixel perfect data displays. Its ability to create infographics and not just charts and metrices is what makes it unique and appealing. In this chapter we will see various features of canvas and how to use the canvas work pads.
Opening a Canvas
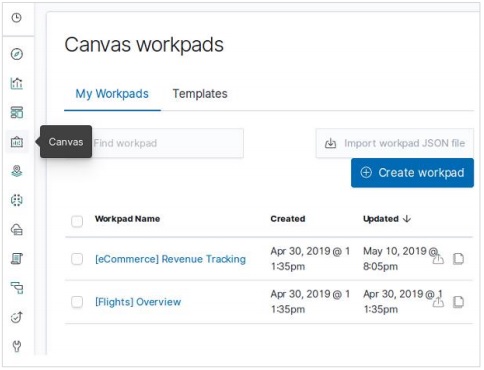
Go to the Kibana homepage and select the option as shown in the below diagram. It opens up the list of canvas work pads you have. We choose the ecommerce Revenue tracking for our study.

Cloning A Workpad
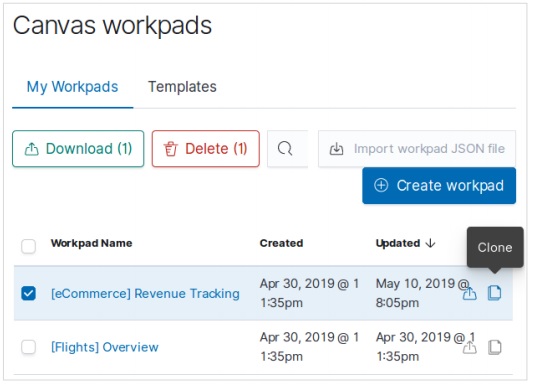
We clone the [eCommerce] Revenue Tracking workpad to be used in our study. To clone it, we highlight the row with the name of this workpad and then use the clone button as shown in the diagram below −

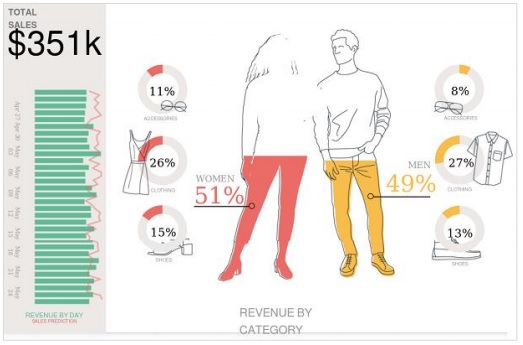
As a result of the above clone, we will get a new work pad named as [eCommerce]
Revenue Tracking – Copy which on opening will show the below infographics.
It describes the total sales and Revenue by category along with nice pictures and charts.

Modifying the Workpad
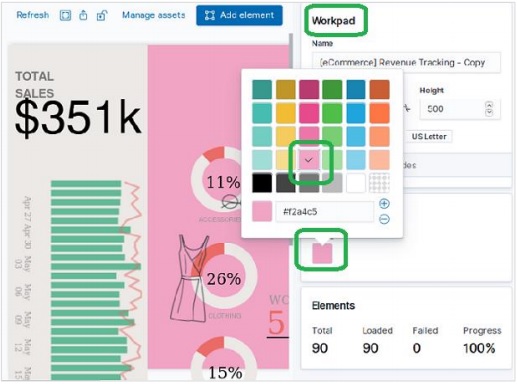
We can change the style and figures in the workpad by using the options available in the
right hand side tab. Here we aim to change the background colour of the workpad by choosing a different colour as shown in the diagram below. The colour selection comes into effect immediately and we get the result as shown below −
