Stretching gamma correction refers to enhancing the overall contrast of an image. This is done by increasing the gamma value, which expands the range of intensity levels of the pixels of the image.
The process of stretching gamma correction involves stretching the original input values to a new broader range of values.
Stretching Gamma Correction in Mahotas
In Mahotas, we can do stretching gamma correction of an image by using the mahotas.stretch() function.
In gamma correction, a gamma value greater than 1 increases the contrast of the image, while a gamma value less than 1 decreases the contrast.
Hence, by stretching the gamma, dark areas of the image become darker, and bright areas become brighter, resulting in a more pronounced distinction between different shades and details.
Using the mahotas.stretch() Function
The mahotas.stretch() function takes an image as input and returns a sharpened version of the image as output. The resulting image has enhanced contrast and improved visibility of details.
The stretch() function determines the minimum and maximum intensity values in the image and transforms them to full range of pixel values (0−255 for 8−bit images).
Syntax
Following is the basic syntax for mh.stretch() function in mahotas −
mahotas.stretch(img, arg0=None, arg1=None, dtype=<class ''numpy.uint8''>)
where,
-
image − It is the input image.
-
arg0 (optional) − It is the minimum value for output (default is 0).
-
arg1 (optional) − It is the maximum value for output (default is 255).
-
dtype (optional) − It is the data type of output image (default is uint8).
Example
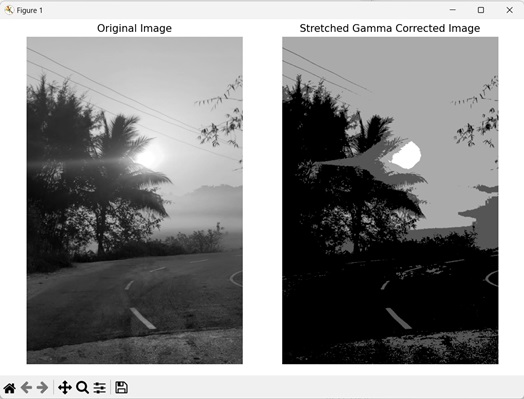
In the following example, we are increasing the contrast of a grayscale image by using mh.stretch() function −
import mahotas as mh
import numpy as np
import matplotlib.pyplot as mtplt
# Loading the image
image = mh.imread(''sun.png'')
# Converting to grayscale
gray_image = mh.colors.rgb2gray(image)
# Decreasing gamma value
corrected_gamma = 3.2
# Applying stretch gamma correction image
stretch_gamma_corrected = mh.stretch(gray_image, corrected_gamma)
# Creating a figure and axes for subplots
fig, axes = mtplt.subplots(1, 2)
# Displaying the original image
axes[0].imshow(gray_image, cmap=''gray'')
axes[0].set_title(''Original Image'')
axes[0].set_axis_off()
# Displaying Stretched gamma corrected image
axes[1].imshow(stretch_gamma_corrected, cmap=''gray'')
axes[1].set_title(''Stretched Gamma Corrected Image'')
axes[1].set_axis_off()
# Adjusting spacing between subplots
mtplt.tight_layout()
# Showing the figures
mtplt.show()
Output
Following is the output of the above code −

Stretching Gamma Correction of RGB Image
We can also perform stretching gamma correction for an RGB image in mahotas using the stretch() function. The gamma value used in the stretch function determines the extent of contrast enhancement.
We can then convert the stretched image back to the RGB color space, by multiplying it by 255 (maximum intensity of an RGB image).
Example
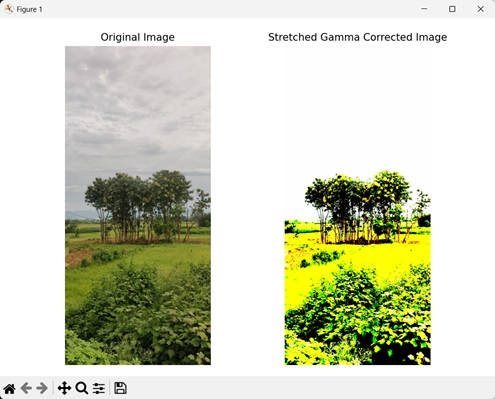
The following example shows increasing of the contrast of an RGB image −
import mahotas as mh
import numpy as np
import matplotlib.pyplot as mtplt
# Loading the image
image = mh.imread(''nature.jpeg'')
# Applying stretched gamma correction
stretched_gamma_corrected = mh.stretch(image, 3)
# Converting the image back to RGB
stretched_gamma_corrected = stretched_gamma_corrected * 255
# Creating subplots to display images
fig, axes = mtplt.subplots(1, 2)
# Displaying the original RGB image
axes[0].imshow(image)
axes[0].set_title(''Original Image'')
axes[0].set_axis_off()
# Displaying the stretched image
axes[1].imshow(stretched_gamma_corrected)
axes[1].set_title(''Stretched Gamma Corrected Image'')
axes[1].set_axis_off()
# Adjusting spacing between subplots
mtplt.tight_layout()
# Showing the figures
mtplt.show()
Output
Output of the above code is as follows −

Interactive Stretching Gamma Correction Slider
An interactive stretching gamma correction slider is a GUI element that allows users to adjust the gamma value to change the contrast dynamically by dragging the slider.
- To stretch gamma correction using an interactive slider in Mahotas, first create a slider for adjusting the gamma value.
- Then, implement a function to retrieve the new gamma value when the slider is moved and apply stretching gamma correction to the image.
- Finally, connect the function to the slider”s value change event, so it is called automatically when the slider is moved.
Syntax
Following is the basic syntax to create an interactive slider −
from matplotlib.widgets import Slider
Slider(slider_axis, name, min_value, max_value, valint)
where,
-
slider_axis − It is a list that defines the position and dimensions of the slider.
-
name − It is the name of the slider.
-
mini_value − It is the minimum value that the slider can go to.
-
max_value − It is the maximum value that the slider can go to.
-
valint − It is the starting value of the slider.
Example
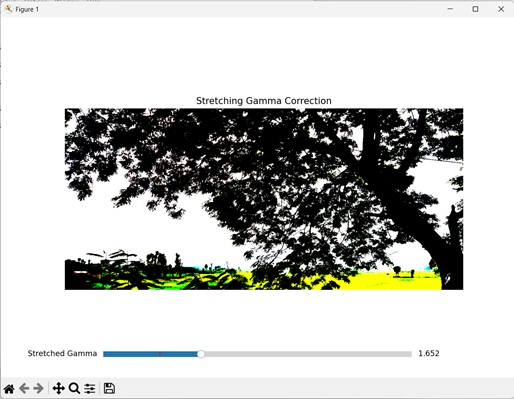
In this example we are increasing the contrast using an interactive slider −
import mahotas as mh
import numpy as np
import matplotlib.pyplot as mtplt
from matplotlib.widgets import Slider
# Loading the image
image = mh.imread(''tree.tiff'')
# Creating a figure and axes for the plot
fig, axis = mtplt.subplots()
# Displaying the original image
axis.imshow(image)
axis.set_title(''Stretching Gamma Correction'')
axis.set_axis_off()
# Creating a slider for stretched gamma adjustment
slider_axis = mtplt.axes([0.2, 0.05, 0.6, 0.03])
stretched_gamma_slider = Slider(slider_axis, ''Stretched Gamma'', 0.1, 5.0,
valinit=1.0)
# Updating the stretched gamma correction and plot on change of slider value
def update_stretched_gamma(val):
   stretched_gamma = stretched_gamma_slider.val
   corrected_image = mh.stretch(image, stretched_gamma)
   corrected_image = corrected_image * 255
   axis.imshow(corrected_image)
   fig.canvas.draw_idle()
stretched_gamma_slider.on_changed(update_stretched_gamma)
# Showing the figure
mtplt.show()
Output
The output produced is as follows −
