The discover functionality available in Kibana home page allows us to explore the data sets
from various angles. You can search and filter data for the selected index patterns. The data is usually available in form of distribution of values over a period of time.
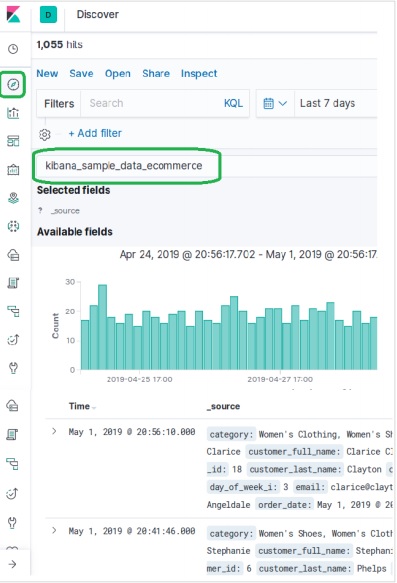
To explore the ecommerce data sample, we click on the Discover icon as shown in the
picture below. This will bring up the data along with the chart.

Filtering by Time
To filter out data by specific time interval we use the time filter option as shown below. By
default, the filter is set at 15 minutes.

Filtering by Fields
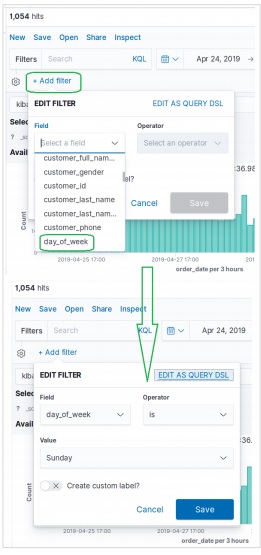
The data set can also be filtered by fields using the Add Filter option as shown below. Here we add one or more fields and get the corresponding result after the filters are applied. In our example we choose the field day_of_week and then the operator for that field as is and value as Sunday.

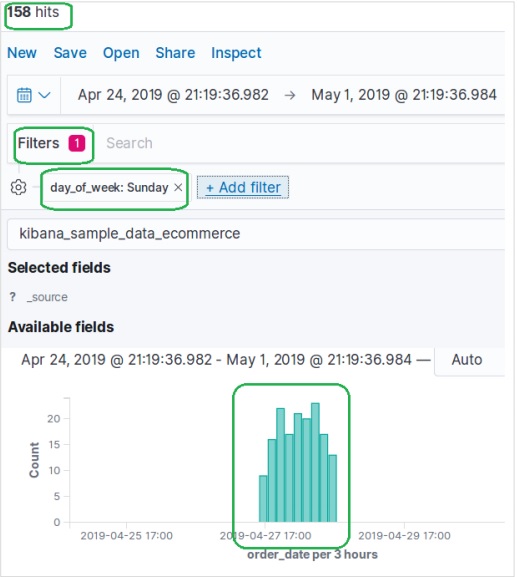
Next, we click Save with above filter conditions. The result set containing the filter
conditions applied is shown below.
